Debugging an AWS Lambda Function Locally with Visual Studio Code (VS Code) on Windows, Linux, and Mac
Want to learn more about AWS Lambda and .NET? Check out my A Cloud Guru course on ASP.NET Web API and Lambda.
Download full source code.
It’s always nice to be able to debug through your code when something is not working as expected.
This is especially true with Lambda functions because once they are deployed you have to rely on logs to see what your code is doing.
Luckily, there is an easy way to debug your Lambda functions locally - you can step through code, hit breakpoints, add watches, look at variables, everything you would expect.
1. Install the tools
Install the .NET Lambda function templates.
dotnet new --install Amazon.Lambda.TemplatesInstall the Lambda Test Tool
dotnet tool install -g Amazon.Lambda.TestTool-6.02. Create a Lambda function
dotnet new lambda.EmptyFunction -n SimpleFunctionVSCodeOpen Function.cs and replace the FunctionHandler(..) code with the following -
public string FunctionHandler(string input, ILambdaContext context)
{
    Console.WriteLine("I am able to debug!");
    return input.ToUpper();
}
3. Update the launch configuration
This is where things differ for Windows, Linux, and Mac.
Windows
Open the launch.json file inside the .vscode directory, and replace the contents with the below -
 1{
 2    "version": "0.2.0",
 3    "configurations": [
 4        {
 5            "name": ".NET Core Launch (console)",
 6            "type": "coreclr",
 7            "request": "launch",
 8            "preLaunchTask": "build",
 9            "program": "${env:USERPROFILE}/.dotnet/tools/dotnet-lambda-test-tool-6.0.exe",
10            "args": [],
11            "cwd": "${workspaceFolder}",
12            "console": "internalConsole",
13            "stopAtEntry": false,
14            "internalConsoleOptions": "openOnSessionStart"
15        }
16    ]
17}
Note on line 9, I use ${env:userprofile}, this works for Windows, but won’t for Linux or Mac. Also, note on line 9, that the program ends with .exe, that won’t be the case for Linux or Mac.
Linux and Mac
Open the launch.json file inside the .vscode directory, and replace the contents with the below -
 1{
 2    "version": "0.2.0",
 3    "configurations": [
 4        {
 5            "name": ".NET Core Launch (console)",
 6            "type": "coreclr",
 7            "request": "launch",
 8            "preLaunchTask": "build",
 9            "program": "${env:HOME}/.dotnet/tools/dotnet-lambda-test-tool-6.0",
10            "args": [],
11            "cwd": "${workspaceFolder}",
12            "console": "internalConsole",
13            "stopAtEntry": false,
14            "internalConsoleOptions": "openOnSessionStart"
15        }
16    ]
17}
Note on line 9, I use ${env:HOME}, and program does not have a .exe at the end.
4. Debugging
Back in the Function.cs file, put a break point on the line -
Console.WriteLine("I am able to debug!");Hit F5 to start debugging. Somewhere in the output of the debug console it will say -
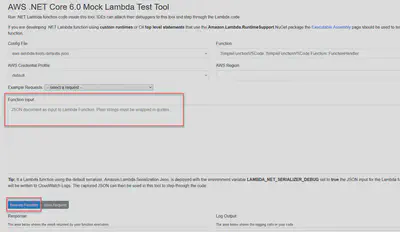
Environment running at http://localhost:5050A browser window will open (if it doesn’t open http://localhost:5050/), and you should see something like this -

Put some text in quotes into the Function input, and click Execute.
The debugger will kick in and hit the breakpoint you set.

You can step through the code now.
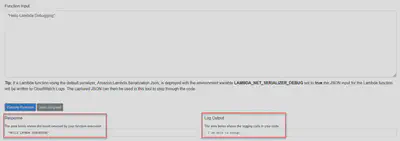
After it has returned, you will see something like this in the browser with the response and log -

Download full source code.